2.3.1. DashBoard
This module is the heart of PyMoDAQ, it will:
Help you declare the list of actuators and detectors to be used for a given experiment (Experiment manager)
Allow you to set particular values for their settings (see StateManager)
Load and run specific extensions such as: * Automatic data acquisition of detectors as a function of one or more actuators using the DAQ_Scan * Log data into advanced binary file or distant database using its DAQ_Logger extension * Optimize data or sampling using the Bayesian or Adaptive extensions * Mix data using the DataMixer * …
The flow of this module is as follow:
At startup you have to define/load/modify an experiment (see Experiment manager) representing an ensemble of actuators and detectors
Define/load/modify a State (see StateManager) representing a state of the control modules settings and some other special state subentries like actuator values
Define/load/modify eventual overshoots (see Overshoot manager)
Define/load/modify eventual ROI (Region of interests) selections (see ROI manager)
Use the actuators and detectors manually to drive your experiment
Select an extension to run: automated scan (DAQ_Scan), log data (DAQ_Logger)…
Note
This module can be started from a terminal, using the command dashboard in an activated environment where
PyMoDAQ is installed.
A list of accepted command-line arguments are available, you can list them using dashboard -h. For now the
accepted arguments are the following:
-expor--experimentfollowed by an existing experiment name will start the dashboard with the selected experiment loaded. For exampledashboard -exp defaultshould start the dashboard with the default experiment.
2.3.1.1. Introduction
This module has one main window, the dashboard (Fig. 2.6) where a log and all declared actuators and detectors will be loaded as instances of DAQ_Move and DAQ_Viewer. The dashboard gives you full control for manual adjustments of each actuator, checking their impact on live data from the detectors. Once all is set, one can move on to different actions.
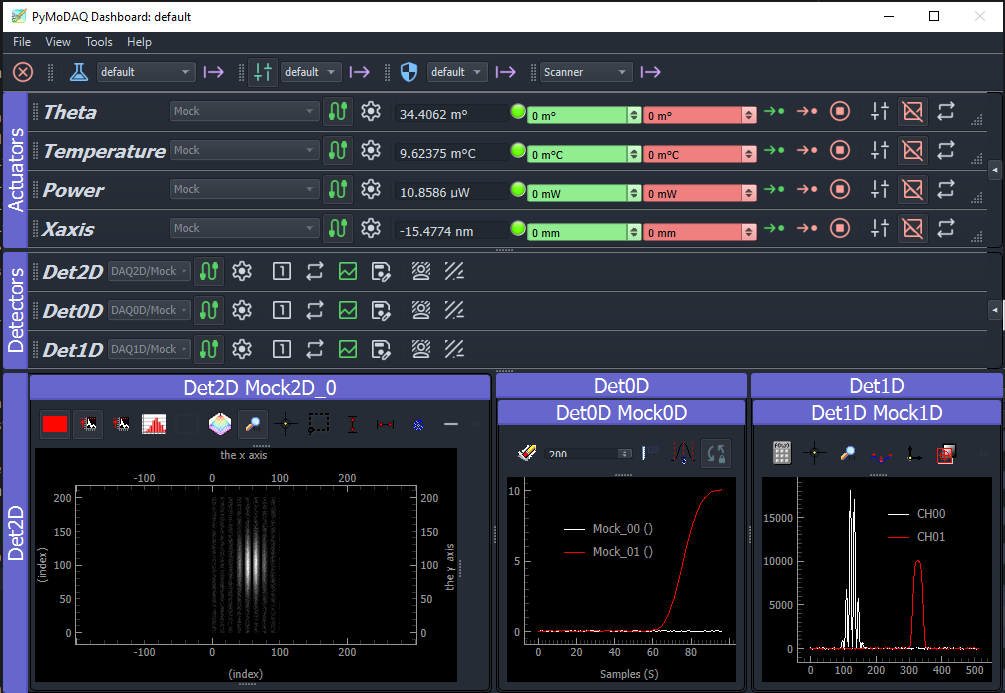
Fig. 2.6 Dashboard user interface containing all declared control modules (actuators/detectors) and some initialization info.
2.3.1.2. Menu Bar Description
Figure Fig. 2.7 displays the menu of the Dashboard window with access to all the tools useful within PyMoDAQ and described below:
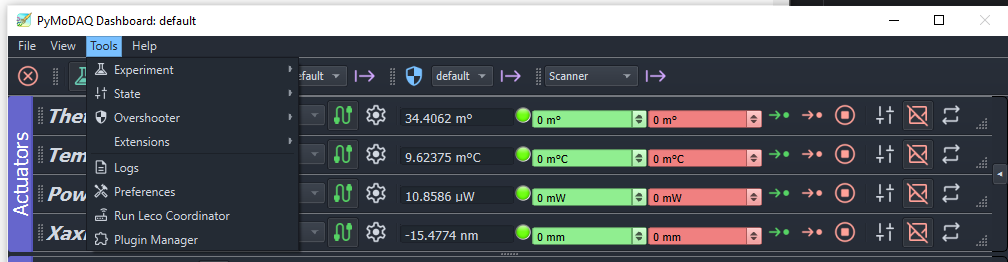
Fig. 2.7 Dashboard menu bar.
The File menu will allow you to:
create a new Experiment file
Restart or Quit the DashBoard
The View menu is allowing the user to save/load layouts of docked windows within the Dashboard and display or not the various toolbars
Note
Docked Windows Layout: when an Experiment has been loaded and if the arrangement of the Control Modules (their docked panels) is modified, then a layout configuration file whose name derive from the loaded experiment filename will be created. At each later loading of this experiment, the Control Modules arrangement will then be restored.
The Tools menu will allow you to:
Open the Experiment Manager (see Experiment manager)
Open the State Manager
the Overshoot Manager
Load Extensions of the DashBoard
Look at the current log file in the default editor. The older logs can be found in the .pymodaq folder, see Configuration.
Open and modify the Preferences related to all pymodaq modules and plugins (see Fig. Fig. 2.8)
Run the leco Coordinator (see LECO communication)

Fig. 2.8 Preferences popup window.
The Tools/Experiment menu enables to create or modify (using the Experiment manager) experiments that are XML files defining a set of actuators and detectors used for a given experiment. Each experiment has therefore a corresponding experiment file. At startup, the program checks for existing experiment files and create a menu entry for each of them.
The State menu, new from version 5.2.x, enables to create or modify (using the StateManager) States that are binary files defining a set of status for the settings of all actuators and detectors declared in the DashBoard (from the loaded experiment). One can therefore easily switch between different states, hence different settings for the control modules. Special actions are also available such as the initialization of control modules (could be interesting if some settings have to be set before initialization) or defining a value for an actuator.
The Overshoot menu is used to configure actions like stoping the acquisition or setting the value of a given actuator when a detected value (from a running detector module) gets out of range with respect to some predefined bounds. For details, see Overshoot manager.
The ROI Modes menu, see ROI manager, is used to save the state of all regions of interest defined by a user within the 1D or 2D viewers declared in the DAQ_Viewers control modules in the Dashboard. You can then, in one go, recall a particular complex configuration for data acquisition.
The Remote/Shortcuts Control menu, see Remote Manager, is used to define key sequences on a keyboard or buttons/joysticks on a gamepad to trigger specific actions from the Control modules, for instance jogging of the actuator values using a joystick or grabing data from a detector using a button.
The Extensions menu let the user load a specific installed extensions. Default ones are the DAQ_Scan or DAQ_Logger ones. More specific ones can be installed, for instance the package Pymodaq Femto
2.3.1.3. The DashBoard toolbar in extensions
Most extensions (DAQ_Scan, DAQ_Logger, PID, DataMixer, Sequencer, Ramping, optimizers…) display a Dashboard toolbar (see Fig. 2.9) so you can interact with the Dashboard without leaving the extension window:
Show/Hide Dashboard: shows or hides the Dashboard window (and its control modules). Closing the Dashboard window only hides it, and it is shown again when the extension is closed
Experiment: a button to open the Experiment manager, a list of the available experiments and a button to apply the selected one. The list is synchronized with the one of the Dashboard
State: a button to open the StateManager, a list of the states defined for the current experiment and a button to apply the selected one

Fig. 2.9 The Dashboard toolbar as displayed in an extension.
When developing an extension deriving from CustomExt, this toolbar is added by calling its
create_dashboard_toolbar method, whose arguments allow to display or not each of the three groups above. See Experiment, State and the Dashboard toolbar in a CustomExt for how an extension uses the Experiment and State managers.
2.3.1.4. Multiple hardware from one controller
Sometimes one hardware controller can drive multiple actuators and sometimes detectors (for instance a XY translation stage). For this particular case the controller should not be initialized multiple times. One should identify one actuator referred to as Master and the other ones will be referred to as Slave. They will share the same controller address represented in the settings tree by the Controller ID entry. These settings will be activated within the plugin script where one can define a unique identifier for each actuator (U or V for the conex in Fig. 2.17). This feature can be enabled for both DAQ_Move and DAQ_Viewer modules but will be most often encountered with actuators, so see for more details: Multiaxes controller. This has to be done using the Experiment Manager