10.1. PyMoDAQ 5.3 (5.3.0)
This page summarizes the changes brought by PyMoDAQ 5.3.0 (about 120 pull requests since 5.2.3). Pull requests are grouped by topic. The complete list is available in the GitHub release notes.
10.1.1. Highlights
PyMoDAQ 5.3.0 ships two new built-in extensions (Sequencer and Ramping) and a deep rework of the internal engine: module loading, scan acquisition, master/slave thread handling and extension workers. The engine is now more robust and can be interrupted. This release also brings a new ROI management, binary and relative actuators with a dedicated UI, a new pymodaq_scripting package and many usability improvements (settings in docks, styles, icons, contextual help). The documentation has been largely rewritten.
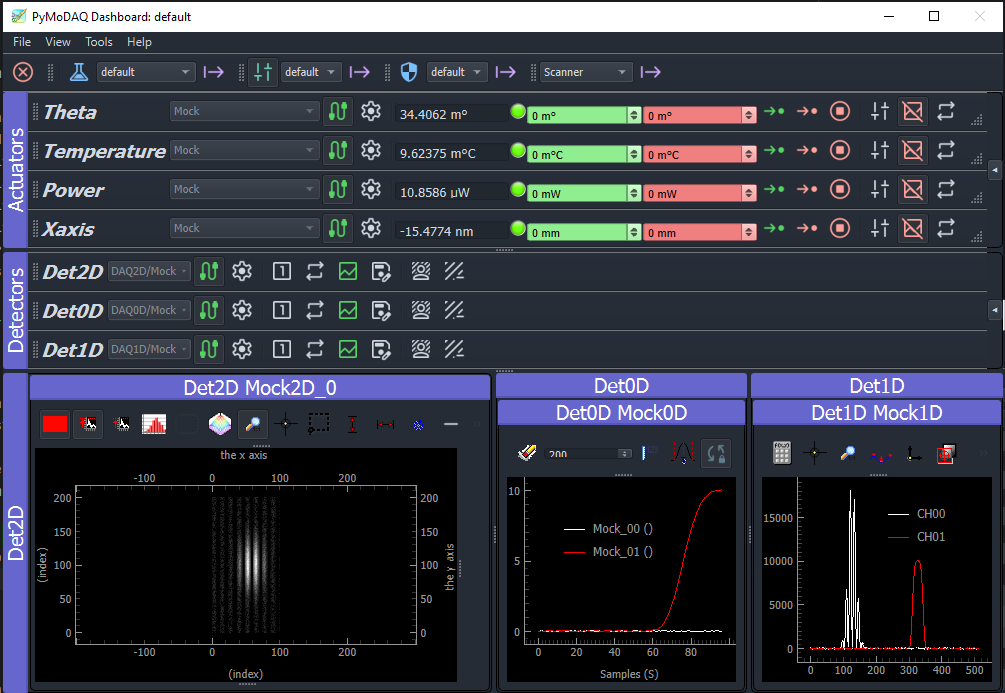
Fig. 10.1 The Dashboard in 5.3.0 with side docks: control module Settings, the ROIs manager and the actuator Controls (Simple and Relative UIs), next to the viewers.
10.1.2. Major new features
10.1.2.1. Sequencer extension (new)
Chain experiment steps (states, moves, scans, conditional choices…) described in .seq YAML files that can also
be written by hand.
Integration of the
pymodaq_plugins_sequencerplugin into PyMoDAQ: #1203Groundwork: serializable Scanner (
to_dict/from_dict) #1180, small additions #1150, shared categorizing module #1195Fixes found while using and documenting it (nested elements never executed, inverted threshold model check, new
sequencercommand): #1222, #1228User and developer documentation: #1227
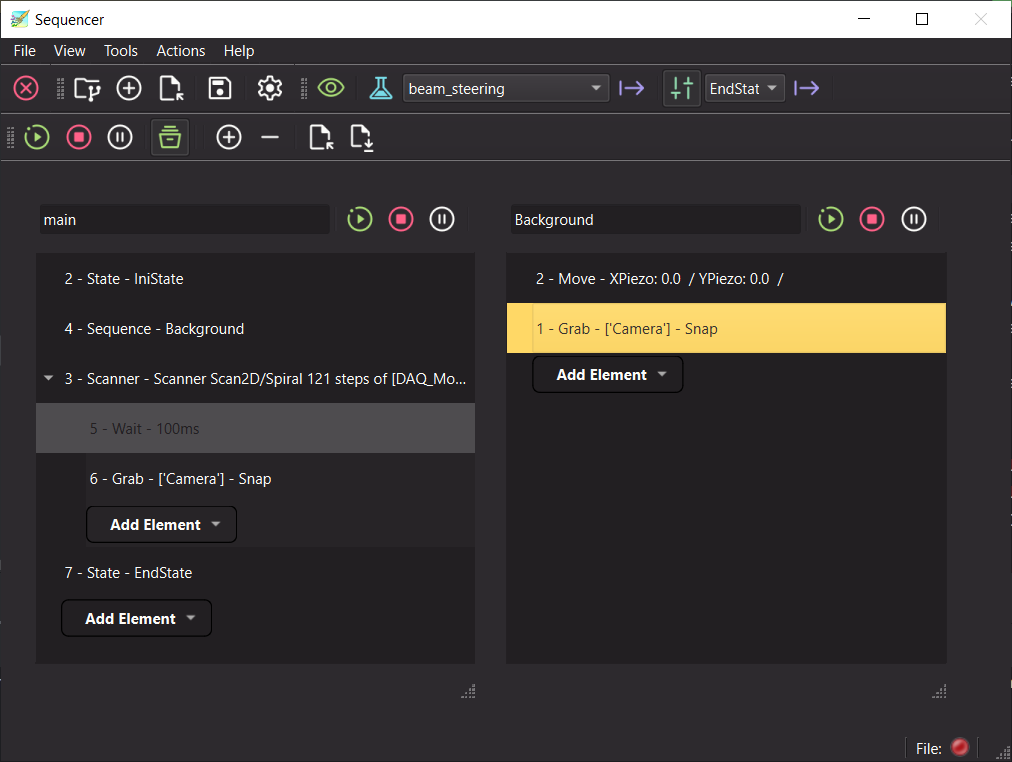
Fig. 10.2 The Sequencer extension: a main sequence calling a sub-sequence, with State, Scanner, Wait, Grab and Move elements.
10.1.2.2. Ramping extension (new)
Continuous sweep of one actuator with fast, live acquisition of the other modules, plus a histogram (live and offline).
Ported into PyMoDAQ: #1215, together with the threaded workers pattern (saving + processing): #1208
Fixes (logged ramps never finished, “Detectors/Actuators to Plot” selection ignored…): #1223, #1231
Documentation: #1230
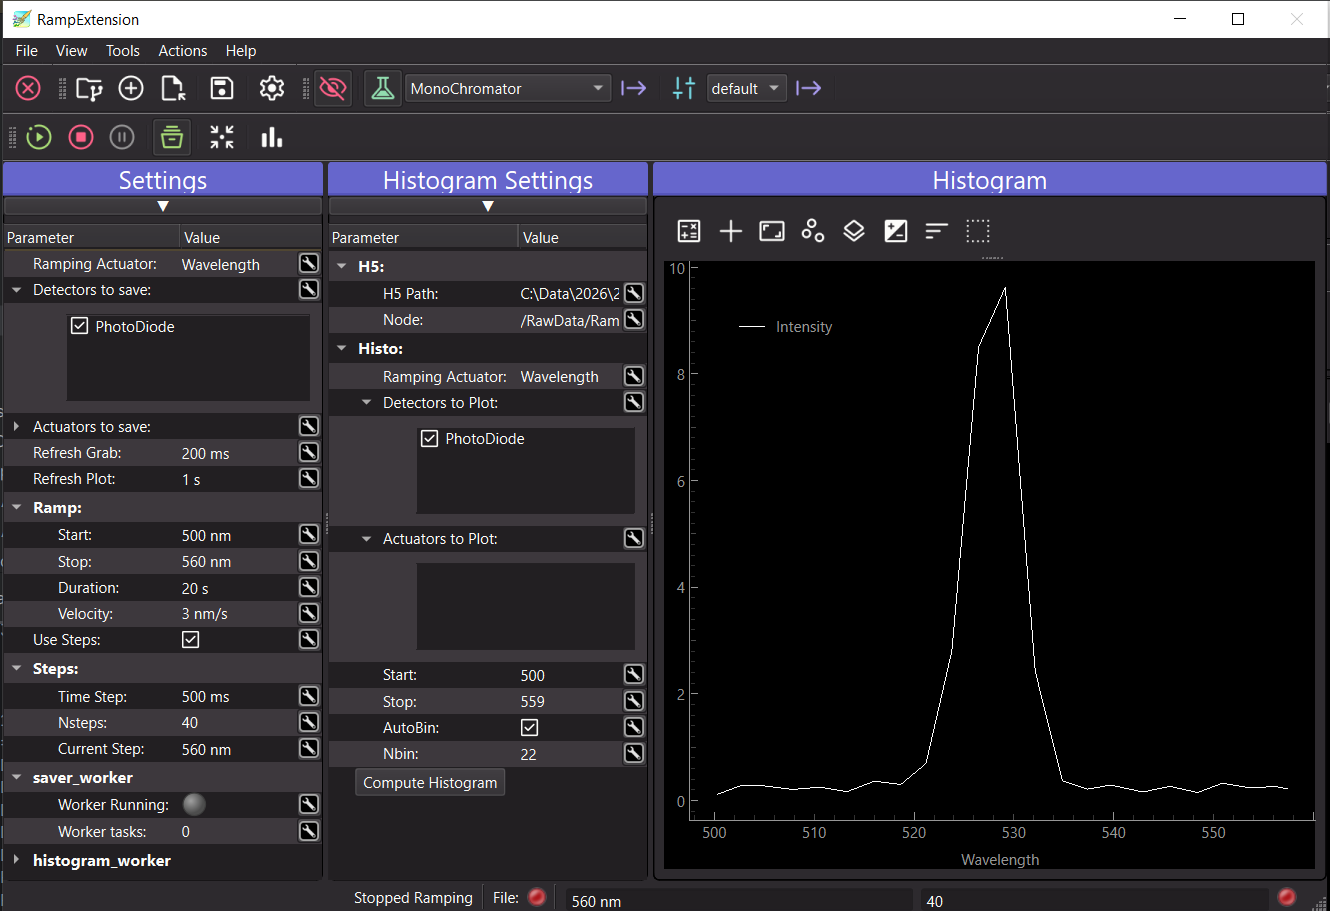
Fig. 10.3 The Ramping extension.
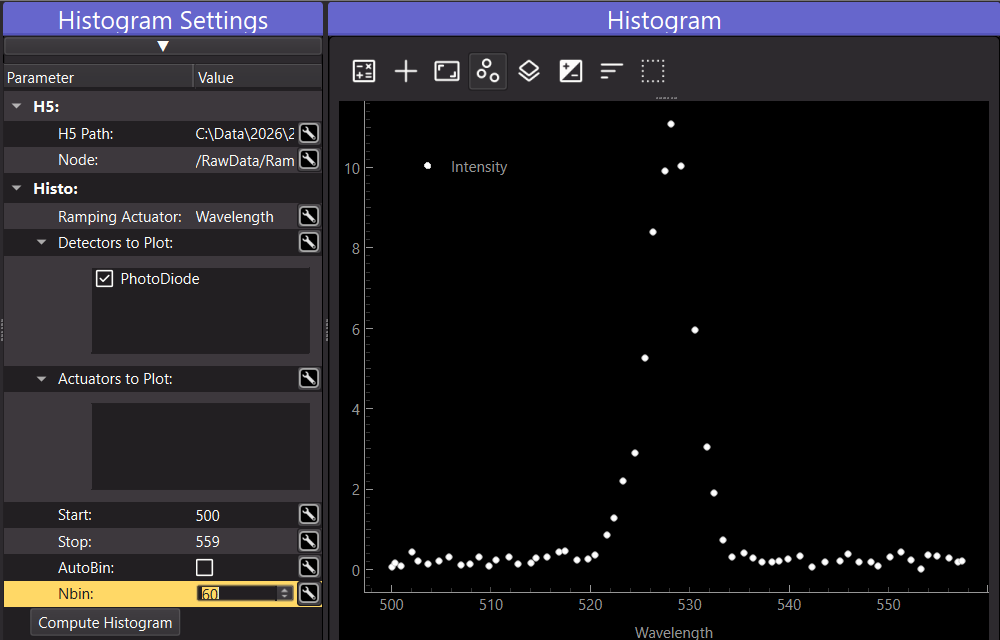
Fig. 10.4 Ramping histogram: time-binned and averaged data versus the ramping actuator value.
10.1.2.3. Binary and relative actuators, UI set by the plugin
Binary UI (two configurable “green/red” positions, no more spinboxes): #1119
Relative UI for actuators without encoder (increment only, optional software encoder through
has_encoder): #1120The DAQ_Move UI is now selected automatically from a plugin class attribute (
ui_type): #1121
Warning
The UI factory mechanism of DAQ_Move changed and is not backward compatible. Access to legacy multi-axes plugins has been restored, with a deprecation warning: #1174

Fig. 10.5 DAQ_Move with the Binary UI.

Fig. 10.6 DAQ_Move with the Relative UI.
10.1.2.4. New ROI management
New ROI core keeping parameters and ROIs in sync (
ROIParameter,ROISync,ROIViewerManager): #1100The ROI Manager is back in the Dashboard (ROIs saved and restored per Experiment): #1107, #1242, with the new
restore_roispreference: #1240ROI select and crosshair are visible again above 2D images, and correctly forwarded to the plugins (viewer index, x/y coordinates, ROI info): #1239, #1240
Various fixes: #1129, #1140. Documentation: #1238, #1241
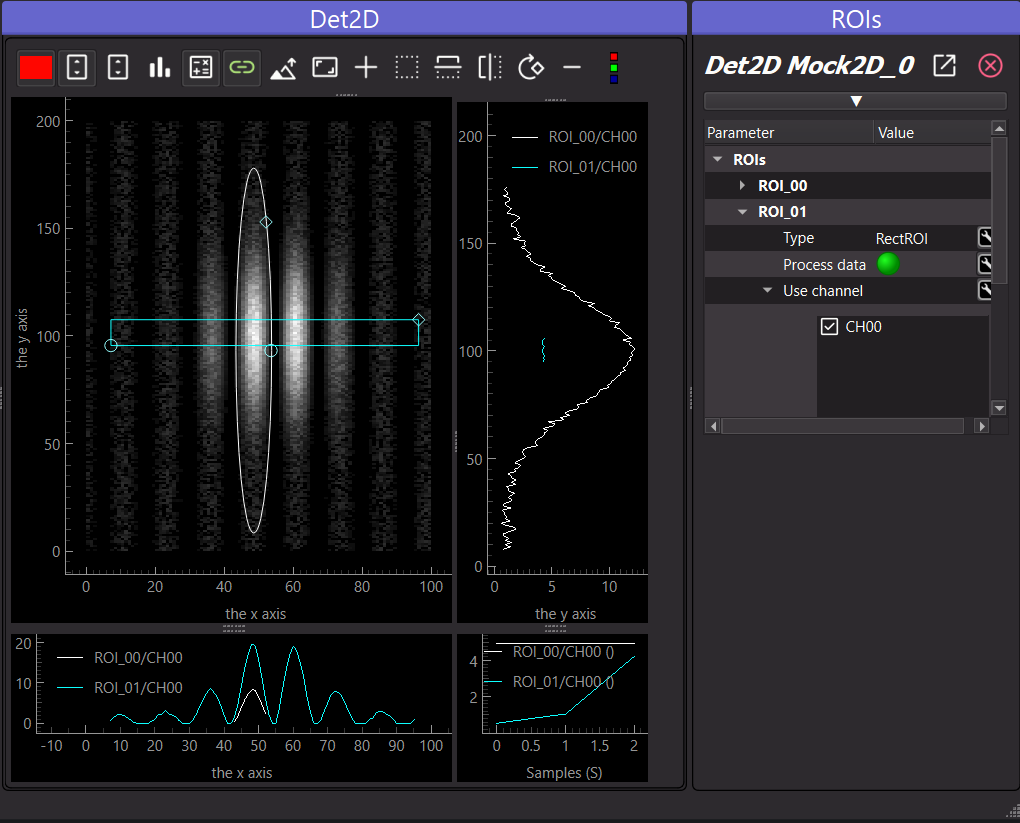
Fig. 10.7 ROIs in a Viewer2D.
10.1.2.5. Settings managers and Scan Manager
New generic
SettingsManager(select settings, save them, then apply them back in order) and its first use, the Scan Manager, to save and reload scan configurations: #1130The State Manager now builds on it, with sequential or parallel application of the states: #1179
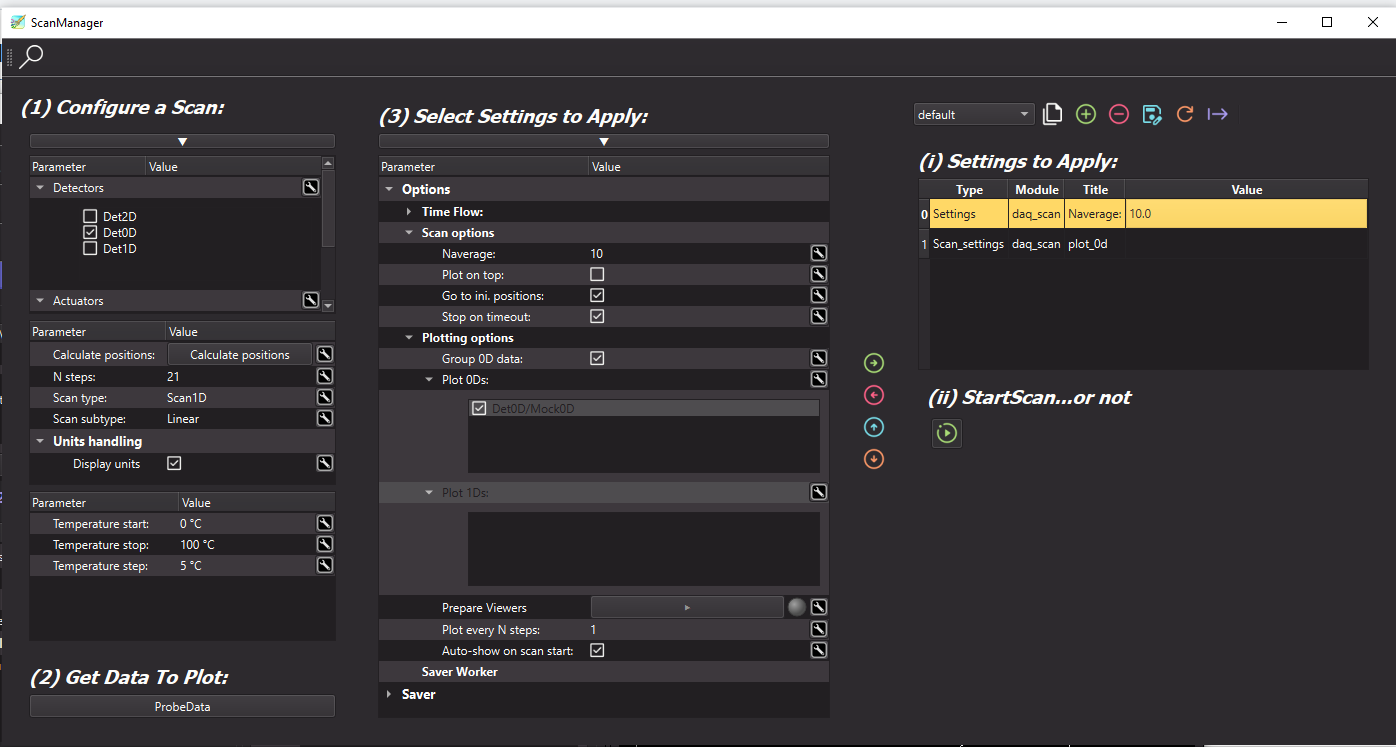
Fig. 10.8 The Scan Manager.
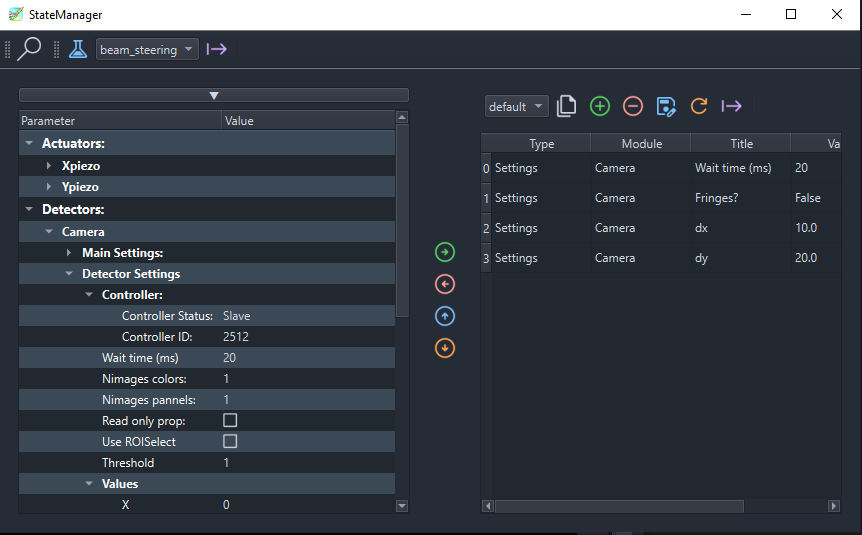
Fig. 10.9 The State Manager.
10.1.2.6. Scripting and LECO
New pymodaq_scripting package to drive modules from scripts, with examples: #1192, #1193
Rework of the LECO integration (less boilerplate, enabled/disabled from a menu, preset/configuration renamed experiment/state): #1099
10.1.2.7. Startup
Start an extension directly with an Experiment and a State:
python -m ... -x experiment -s state: #1152Starting the LECO coordinator at startup is now a preference (disabled by default): #1154
10.1.3. Internal engine rework
Module loading in the Dashboard uses a state machine and signals, without polling or
processEvents: #1156, #1161Scan acquisition rewritten as steps chained by signals (asynchronous move/grab). This is the basis for pausing or optimizing during a scan: #1177, with matching saving changes: #1199
Master/slave: controller and thread are shared, so a slave (or the master) can be de-initialized and re-initialized without restarting everything: #1110, #1175, #1224
Extension workers and common workflow actions (DAQ_Scan, Logger, Sequencer): #1202, #1204
H5 saving mechanisms factorized in CustomApp/CustomExt: #1143, #1186, #1205
Hardware threads are properly stopped when quitting the Dashboard during an Experiment loading: #1236. Control modules quit properly when standalone: #1187. Qt threads destroyed during tests: #1178
10.1.4. Major bug fixes
Averaged scans (Naverage > 1) were neither saved nor plotted, Scan Manager “ProbeData” crash, ROI channel selection: #1248. Averaging is now limited to 1 for scans generating spread data (tabular, RandomSpread): #1251
H5 saving: SWMR error after the first scan, “New File” button doing nothing: #1220
Tabular scans save and load: #1088. Module saving: #1081. DWA errors not saved, and any file can now be opened in the H5Browser: #1168
DataToExport: unified arithmetic operators,
==could wrongly return True,average()modified the original container: #1216DAQ_type/detector_typeswapped at DAQ_Viewer initialization: #1244 (and backward compatibility #1151)Timeout during a scan: option to keep the scan running, and the faulty instrument is logged: #1061
Deleting or recreating an Experiment now removes the right related files: #1233
Live averaging reset when stopping the grab: #1095. Averaging metadata stored in the data and the h5 files: #1045
Miscellaneous: PID (#1139), scaled units (#1159), threshold with NaNs (#1148), recent pyqtgraph compatibility (#1171), warnings and import errors (#1162), shared windows visibility (#1135, #1141, #1176), Dashboard toolbar (#1124), display errors in 0D scans (#1184), duplicated logger entries (#1112), flipped/colored icons (#1103)
10.1.5. User interface and usability
Control module settings in a popup or in a dock (controls and viewers in the same window): #1117, with close/detach buttons: #1166. Meaningful popup titles: #1108
New DAQ_Scan window: reorganized panels,
plot_every_n_steps(0 disables live plotting): #1221, #1249, #1250Contextual help (“?” icon showing a
help.mdfile): #1235, #1246Viewers: timestamps as axis and scatter mode for 0D data (#1083), optional graph below LCDs (#1128), white background with the light style and configurable line width (#1127), default toolbar state in the configuration (#1109), dock label hidden when there is a single viewer (#1188)
Toolbar button style (icons, text…) from the View menu: #1234
Multi-state LED and consistent status color palette: #1207, #1210, #1211, #1218
Material icons, new icons and rotation: #1093, #1098, #1105, #1115, #1191, #1198. Combo and menu-button widgets: #1104, #1149. Resizable ParameterTree columns: #1144
DAQ_Viewer default saving folder taken from the configuration: #1206

Fig. 10.10 The new DAQ_Scan window.
10.1.6. Cleanup and documentation
DAQ_Viewer: obsolete Overshoot and Axis options and dead code removed: #1244
Documentation: API build fixed (352 to 2 warnings) #1229, Configuration page rewritten #1232, DAQ_Viewer and data viewers #1243, DAQ_Scan and Scan Manager #1246, plus the Sequencer, Ramping and ROI pages listed above
Miscellaneous: #1073, #1074, #1077, #1091, #1101, #1122, #1125, #1126, #1133, #1138, #1146, #1147, #1153, #1155, #1157, #1160, #1170, #1190, #1194, #1195, #1196, #1197, #1200, #1201, #1213, #1214, #1225, #1226