PyMoDAQ Logo

Supported instruments

  • Supported instruments

Documentation

  • 1. Quick Start
  • 2. User’s Guide
    • 2.1. Tips/Issues for installation
    • 2.2. DashBoard and Control Modules
    • 2.3. Dashboard Extensions
      • DAQ Scan
        • 1. Introduction
        • 2. Main Control Window
        • 3. Scan Flow
        • 4. Various settings
        • 5. Scanner
        • 6. Navigator
        • 7. Scan Batch Manager
      • 2.3.1. DAQ Logger
      • 2.3.2. PID Module
      • 2.3.3. Bayesian Optimisation
      • 2.3.4. H5Browser
      • 2.3.5. Console
    • 2.4. Configuration
    • 2.5. Useful Modules
    • 2.6. TCP/IP communication
    • 2.7. LECO communication
    • 2.8. Plugin Manager
  • 3. Tutorials
  • 4. Data Management
  • 5. Developer’s Guide
  • 6. Glossary Terms
  • 7. Library Reference
  • 8. About

Related projects

  • PyMoDAQ Femto
  • PyMoDAQ Plugins DAQmx
PyMoDAQ
  • 2. User’s Guide
  • 2.3. Dashboard Extensions
  • DAQ Scan
  • 6. Navigator
  • View page source

6. Navigator

From version 1.4.0, a new module has been added: the Navigator (daq_utils.plotting.navigator). It is most useful when dealing with 2D scans such as XY cartography. As such, it is not displayed by default. It consists of a tree like structure displaying all currently saved 2D scans (in the current dataset) and a viewer where selected scans can be displayed at their respective locations. It can be displayed using the Settings menu, Show Navigator option. Fig. 6.1 shows the DAQ_scan extension with activated Navigator and a few scans. This navigator can also be used as a Scan Selector viewer to quickly explore and select areas to scan on a 2D phase space.

navigator

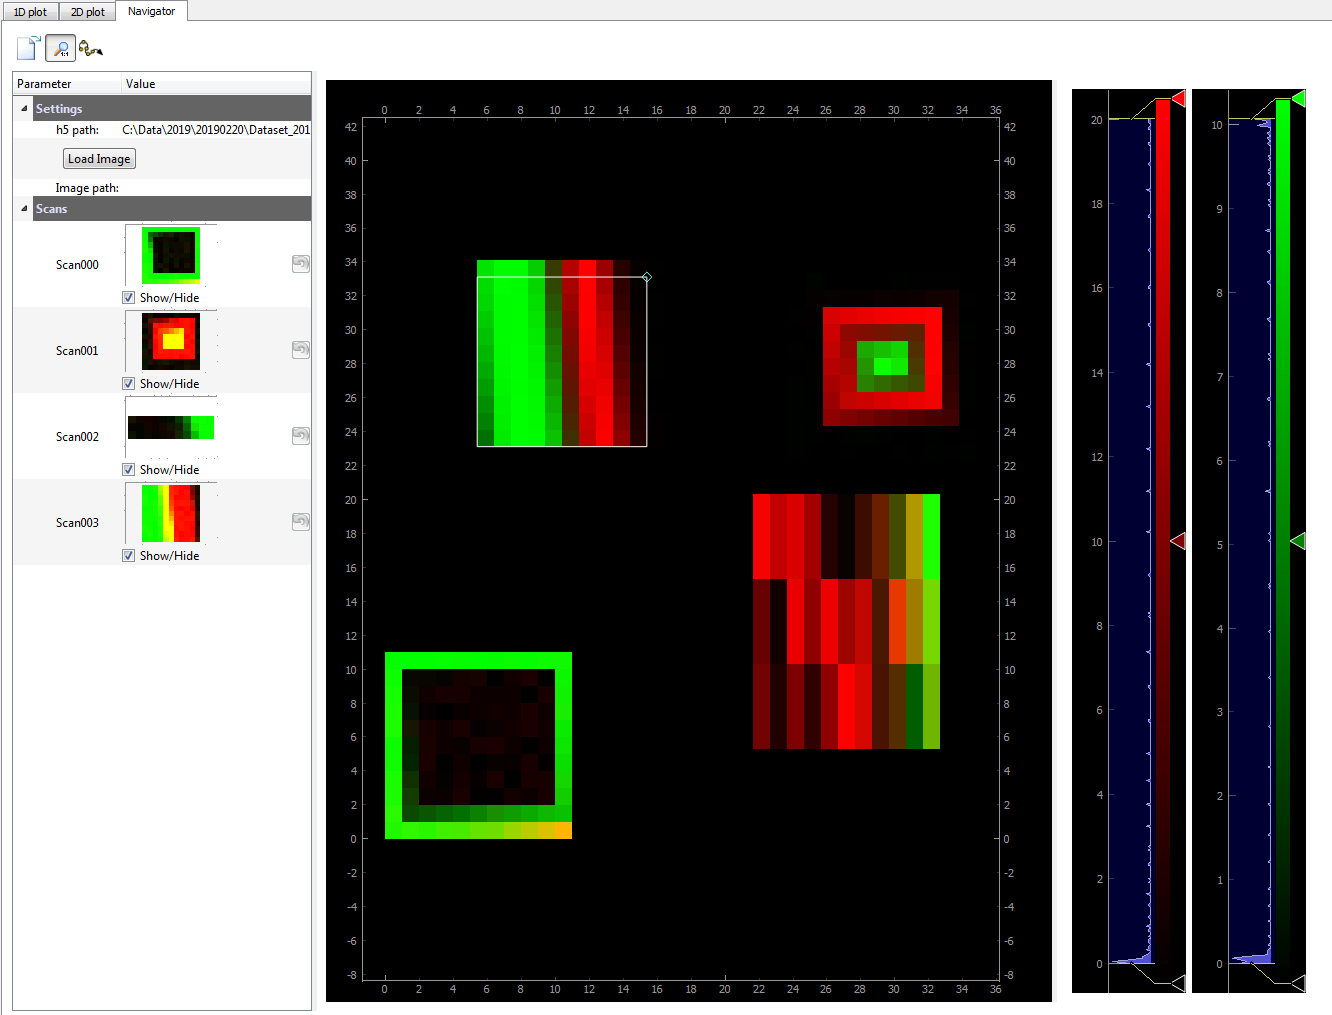
Fig. 6.1 An example of dataset displaying several 2D scans at their respective locations (up and right axis)

Previous Next

© Copyright 2025, Weber Sébastien.

Built with Sphinx using a theme provided by Read the Docs.