2.8. DashBoard Managers
Note
Since version 5.2.0 all the DashBoard Managers below share the same structure (see API and description below).
A DashBoard Manager is a GUI allowing to create entries for a given task. These entries are saved (and loaded) as files in the pymodaq system-wide configuration folder. The Manager GUI allows a unified framework to deal with entry creation, deletion, copy, reloading and execution (see Fig. 2.102).

Fig. 2.102 A toolbar to browse, duplicate, create, delete, save, reload and execute a given entry managed by the manager.
- The entries browsing and execution is incorporated in the DashBoard toolbar (see Fig. 2.6
and Fig. 2.103 below)

Fig. 2.103 Toolbar from the manager incorporated into the DashBoard. The various managers can be opened from there and entries can be browsed and directly executed. In red, the Experiment toolbar, in blue the State toolbar, in yellow the Overshoot toolbar and in purple the Extension toolbar (see below)
Depending on the task it manages, a manager entry will be different (see below an Experiment entry and a State entry). An Experiment features a list of actuators and detectors in a Parameter Tree while a State is a list of actions one can perform on control modules settings for a given Experiment, all this in a table.
2.8.1. Experiment manager
The Experiment manager is an object that helps to generate, modify and save a set of Control Modules to be displayed in a DashBoard.
An Experiment entry is a set of actuators and detectors represented in a tree like structure, see Fig. 2.104.
Note
As of version 5.2.0, PyMoDAQ changed the vocabulary related to presets and split this concept into Experiment (a set of instruments: either actuators or detectors) and State (particular values of the instruments settings, actuators value…). Both Experiment and State can be loaded at any time
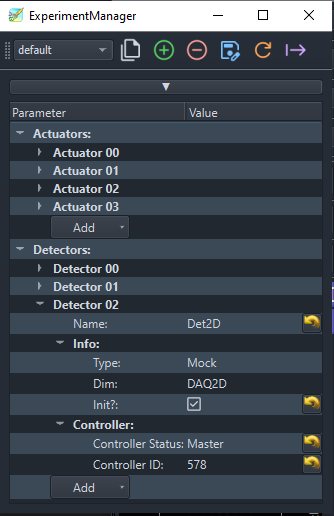
Fig. 2.104 An example of an Experiment creation named default containing 4 actuator modules and 3 detector modules.
Only a few options are available for the Experiment. It is merely there to configure the type and list of control modules to be added in the DashBoard. The only options are related to the master/slave status (see Multiple hardware from one controller) and if it should be initialized at startup. For configuration of the initial settings of the control modules, see below the StateManager.
2.8.2. StateManager
Note
New in version 5.2.0
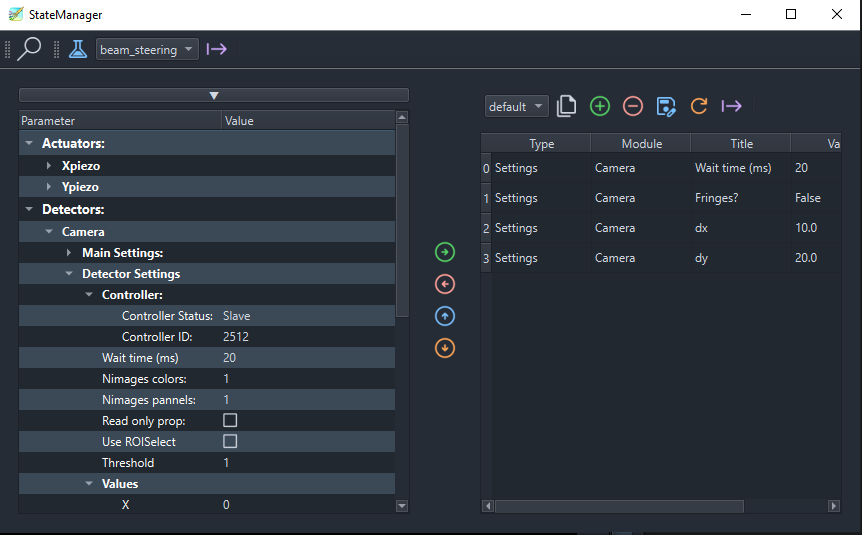
Fig. 2.105 An example of a State creation named default and related to the beam_steering Experiment This State contains 5 subentries: three to set some specific settings to the Theta and Xaxis actuators, one to set the Temperature actuator’s value and one to set the Det1D detector’s setting. This default configuration is executed at startup just after the Experiment has been loaded. Each subentry is set sequentially in the order displayed in the right table. You can easily drap/drop items.
Once the Experiment manager is done loading its configured control modules, the StateManager can be opened. In fact, for each Experiment file, a state called default (empty by default) will be created and loaded after the loading of the control modules. But then any predefined State can be loaded at any time.
A State is made by selecting a given settings (left side of figure Fig. 2.105) and dragging/dropping it to the table on the right. You can also use double clicking a setting to move it to a State or use the right arrow in the middle of the window. If you select a group parameter, all its children will be moved in the State. All but only the ones that are valid as State allowed settings.
Three special state subentries are available from the context menu (right click while the mouse is hovering the State table), see Fig. 2.106.
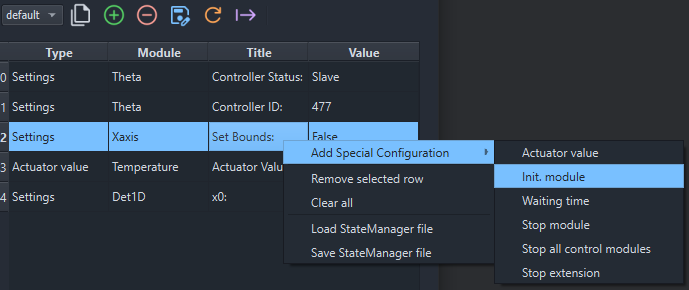
Fig. 2.106 The StateManager context menu
These allow to define:
the Initialization of a given control module
the value of an Actuator (an absolute move will be done)
a Waiting time before moving to the next subentry
stopping control modules or extensions
There are also many ways to move around and delete the subentries: either using the arrows in the middle of the window (look at their tooltip) or shortcuts: Ctrl+Up to move up, Del to delete…
2.8.3. Extension Manager
The Extension Manager is using the Manager Framework to allow the display of all installed Dashboard Extensions. You cannot really configure Extensions as you do with Experiments or States but the manager framework allow to have built in toolbar (see Fig. 2.103 in purple), to be used as a shortcut to quickly load an extension from the DashBoard or from other Modules (like the launcher).
If loading an Extension from somewhere else than from a DashBoard, an empty DashBoard will be created first. You’ll then have to load first an Experiment before you can use your extension.
2.8.4. Overshoot manager
Note
As of version 5.2.0 the overshoot manager has also be rewritten to use the general framework described above and also to use entries from the StateManager to trigger a safe state of your experiment setup…
The Overshoot manager, triggered either from the toolbar or the Tools menu (see Fig. 2.103 in yellow), is used to configure safety actions (for instance the absolute positioning of one or more actuators, such as a beam block to stop a laser beam) when a detected value (from a running detector module or actuator’s value) gets above or below some predefined threshold, see Fig. 2.107. A given Overshoot is set for a given Experiment and will trigger a predefined State. For one Experiment, one can define several Overshoot each with their given State. However, only one at a time is activated.
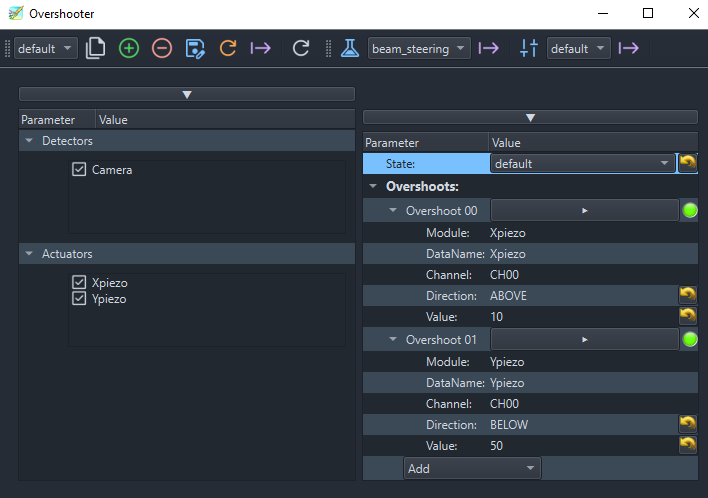
Fig. 2.107 An example of an Overshoot creation named default trigger the default State by monitoring if the value of the Xpiezo is above 10 or if the Ypiezo is below 50.
2.8.5. ROI manager
The ROI manager saves and restores in one click the regions of interest (ROIs) defined in the viewers of the detectors of the Dashboard (see Regions of interest for how to define ROIs in a viewer).
Its entries are attached to the current Experiment: an entry named after the Experiment is created automatically when the Experiment is loaded. Entries are stored in the rois folder of the user .pymodaq folder (see Configuration).
Its window shows two lists, see Fig. 2.108:
Viewers: the viewers of all the detectors of the Dashboard (use the Update viewers button, first of the toolbar, to refresh it after adding or removing detectors);
ROIs: the ROIs defined in these viewers, named
detector/viewer/ROI_xx/type. The checked ones are the ones saved in the entry when saving it.
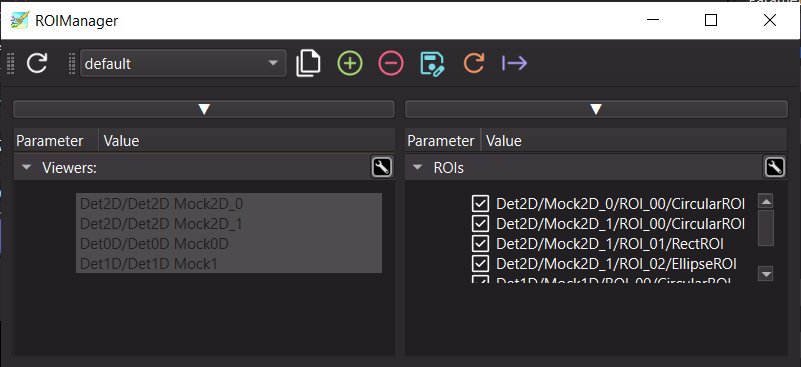
Fig. 2.108 The ROI manager with the entry of the default Experiment. The toolbar gives the usual manager actions (refresh the viewers list, browse, copy, create, delete, save, reload and execute an entry). On the left the viewers of the Dashboard detectors, on the right the ROIs defined in these viewers.
Executing an entry (from the ROI manager or from the ROIs menu and toolbar of the Dashboard) re-creates its ROIs in the corresponding viewers and shows their ROI panel. Detectors or viewers of the entry that no longer exist in the Dashboard are skipped.
By default, the ROIs are not restored when an Experiment is loaded. Set restore_rois = true in the [viewer]
section of the pymodaq preferences (see Preferences files) to execute the ROI manager entry of the Experiment
each time it is loaded.
2.8.6. Remote Manager
In construction