2.5.6. Ramping

Fig. 2.81 The Ramping extension during a ramp: settings (left), histogram settings and live histogram (right).
2.5.6.1. Introduction
The Ramping extension drives one actuator linearly from a start to a stop value in a given duration, while the selected detectors and actuators are acquired continuously and live, without waiting for the actuator. It is made for continuous sweeps (temperature, current, voltage, delay line…) where the DAQ_Scan stop-and-measure approach would be too slow.
2.5.6.1.1. Typical workflow
Define an experiment in the Dashboard and apply it with the Dashboard toolbar of the extension: the workflow actions are enabled once it is applied.
In the Settings dock, choose the ramping actuator, its start and stop values, the duration (or the velocity), and the detectors and actuators to record.
Press Init Positions to move the ramping actuator to its start value, to prepare the setup.
Check Log to save all the data with time stamps in a h5 file and to display the live histogram, then press Start: the actuator goes to the start value, then the ramp and the acquisition begin and end after the duration.
Pause and Stop act at any time. The histogram, the data as a function of the ramped value, can be recomputed after the ramp with Update Histogram, or later from the saved file.
2.5.6.1.2. Good to know
The extension only sends target values on a time schedule: choose the settings according to what your actuator can do (maximum velocity, acceleration) and to the acquisition rate of the detectors.
Without steps a single move to the stop value is sent and the hardware is expected to ramp by itself (temperature controller, power supply…). Its speed must then be consistent with the duration.
Data still waiting to be saved are written when the ramp is stopped: the extension cannot be closed before.
The Ramping extension is made for fast and live acquisition, as opposed to the DAQ Scan that moves an actuator step by step and acquires data once it has reached each position:
fast: the actuator never stops and the acquisition never waits for it. Each module is acquired continuously, at its own rate, as fast as the hardware (and the Refresh Grab setting) allows. Where a scan gives one point per position, a ramp gives as many points as the detectors can produce during its duration, with no dead time spent waiting for the moves to be done
live: the data are displayed in the viewers of the modules while being acquired, and the result of the ramp (the data as a function of the ramped value) is computed and plotted during the ramp, so you can follow the experiment and stop it as soon as you have seen what you were looking for
Everything is logged with time stamps in a h5 file, as the DAQ_Logger does. As the data are acquired asynchronously, the extension rebuilds the data as a function of the ramping actuator value by binning them in time and averaging them: this is the histogram, plotted live during the ramp and that can be recomputed later from the saved file.
2.5.6.2. Launching the Ramping extension
Like the other extensions, the Ramping extension is started from the Extensions menu of the DashBoard (entry Ramping). It then acts on the actuators and detectors declared in the Dashboard.
It can also be started on its own using the ramping command (installed with PyMoDAQ), or by running the
ramping.py module. A Dashboard is created under the hood, then select and apply an experiment using the Dashboard
toolbar of the extension (see The DashBoard toolbar in extensions):
ramping
# or
python -m pymodaq.extensions.ramping.ramping
Note
The ramping actuator and the modules to record are chosen among the modules of the Dashboard: an Experiment must be applied before the workflow actions (Start, Stop, Pause, Log) and the Init Positions action are enabled.
2.5.6.3. The User Interface
The main window (see Fig. 2.81) is made of:
the toolbar, described below
the Settings dock, to configure the ramp and the modules to record, see Settings
the Histogram Settings and Histogram docks, see The histogram. They are only shown when the Log action is checked
a hidden Saving dock with the settings of the h5 file, shown using the Show h5 settings action of the file toolbar
the status bar, see Status bar
2.5.6.3.1. Toolbar
The toolbar contains:
the h5 file actions, to select or create the h5 file where data will be logged, to show the saving settings and to open an existing file. They are provided by the The H5 file manager shared by many extensions. In this extension, the Open file action opens the file in read mode, to compute the histogram of a previous ramp, see Offline analysis
the Dashboard toolbar, to show/hide the Dashboard and to select and apply experiments and states, see The DashBoard toolbar in extensions
the workflow actions:
Start: moves the ramping actuator to the Start value, waits for the move to be done, then starts the acquisition of the modules and the ramp itself, see Running a ramp
Stop: stops the ramp and the acquisition. The ramping actuator stays where it is
Pause: pauses/resumes the ramp
Log: if checked when starting, all data are logged in the h5 file and the live histogram is displayed, see Data logging. Checking/unchecking it also shows/hides the histogram docks
Init Positions: moves the ramping actuator to the Start value of the ramp, for instance to prepare the setup before starting, or to go back after a ramp
Update Histogram: recomputes the histogram using the current histogram settings. It is enabled once a ramp has been started or a file has been loaded
2.5.6.3.2. Settings
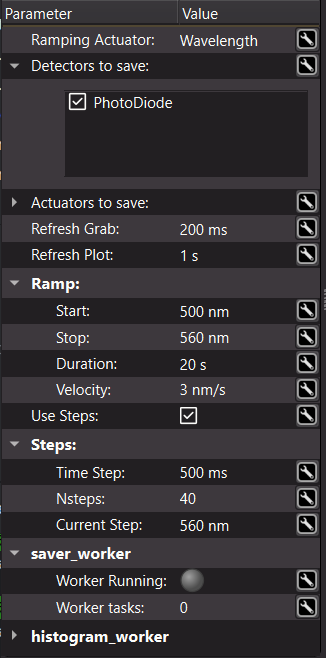
Fig. 2.82 The settings of the Ramping extension.
The settings (Fig. 2.82) are:
Ramping Actuator: the actuator of the Dashboard to be ramped. The units of the ramp values are the ones of this actuator
Detectors to save: the detectors to be grabbed and logged during the ramp
Actuators to save: other actuators whose values are polled and logged during the ramp (the ramping actuator is not listed here, its value is always recorded). For instance the sample temperature measured by a sensor declared as an actuator while the heater power is ramped
Refresh Grab: the period at which the data are acquired during the ramp. It is used to set the Wait time of the selected detectors (time between two grabs in continuous mode) and the refresh timeout of the selected actuators and of the ramping actuator (period at which their current value is polled)
Refresh Plot: the period at which the live histogram is recomputed and displayed
Ramp:
Start / Stop: the initial and final values of the ramping actuator. Stop may be lower than Start to ramp down
Duration: the time to go from Start to Stop
Velocity: the corresponding ramp speed, in actuator units per duration units
Only one of Duration and Velocity is editable, the other one is computed from it, Start and Stop. By default the Duration is set by the user. This, as well as the units of the duration, is set in the configuration file, see Configuration
Use Steps: how the ramp is applied to the actuator, see Running a ramp:
checked: the extension computes the ramp itself and sends a new target value to the actuator every Time Step
unchecked: the extension sends a single move to the Stop value and lets the hardware ramp at its own speed
Steps (only displayed if Use Steps is checked):
Time Step: the time between two successive target values sent to the actuator
Nsteps: the resulting number of steps (Duration / Time Step), read only
Current Step: the current target value of the ramp, updated while ramping
saver_worker and histogram_worker: read-only status of the threads saving the data and computing the histogram: running or not and number of pending tasks
2.5.6.3.3. Status bar
The status bar displays, from left to right:
a message giving the current status of the extension: Moving to Init value, Started Ramping, Stopped Ramping…
the indicators of the The H5 file manager: the h5 file currently used and its status
the current target value of the ramp (in the units of the ramping actuator)
the total number of steps of the ramp (1 when Use Steps is unchecked)
a LED, green while ramping, red otherwise
2.5.6.4. Running a ramp
When Start is triggered, the extension:
moves the ramping actuator to the Start value and waits for it to be reached
applies the Refresh Grab period to the selected modules and, if Log is checked, creates a new node in the h5 file (see Data logging)
starts the continuous grab of the selected detectors and the continuous polling of the current values of the ramping actuator and of the selected actuators
starts the ramp, then stops everything once the Duration has elapsed
The ramp itself depends on the Use Steps setting:
with steps: every Time Step, the target value is computed from the time elapsed since the start of the ramp,
value = start + (stop - start) * elapsed_time / duration, and sent to the ramping actuator as an absolute move. As the target value depends on the actual elapsed time, the ramp stays on schedule even if a step is delayed. The actuator moves are not waited for: choose a Time Step compatible with the time your hardware needs to apply a new value. This mode works with any actuatorwithout steps: a single absolute move to the Stop value is sent at the beginning and the hardware is expected to ramp by itself, for instance a temperature controller or a power supply with a configurable ramp rate. The speed of the ramp is then the one of the hardware: make sure it is consistent with the Duration of the extension, as the acquisition is stopped once this duration has elapsed
Pause stops sending new target values and stops logging the data. When resuming, the ramp goes on from where it was paused: the time spent in pause is not taken into account. Without steps, the hardware is not paused and keeps on ramping.
Stop stops the ramp and the acquisition at any time. The data still waiting to be saved are written to the file before it is closed (see the saver_worker status in the settings): the extension cannot be closed until this is done.
2.5.6.5. Choosing the ramp parameters
The extension doesn’t know what your hardware can do: it computes target values on a time schedule and sends them, without waiting for the actuator. The settings must therefore be chosen according to the capabilities of the actuator, mostly its maximum velocity (and acceleration), and of the detectors, mostly their acquisition rate.
2.5.6.5.1. The ramp velocity
The velocity of the ramp, (Stop - Start) / Duration (displayed in the Velocity setting), must be lower than
the maximum velocity of the actuator, with some margin to account for its acceleration and for the time needed to
process each command. If it is not the case, the actuator lags behind the ramp: when the Duration has elapsed, the
acquisition stops while the actuator has not reached the Stop value yet. In other words, the minimum duration of a
ramp is (Stop - Start) / max velocity.
Setting ramp_setting = [ "velocity", "duration",] in the configuration (see Configuration) is
convenient here: you directly enter a velocity compatible with your hardware, and the duration is computed.
2.5.6.5.2. The time step
With Use Steps checked, the actuator moves by Velocity * Time Step at each step. A new target is sent every
Time Step, whether or not the previous one has been reached, so:
the Time Step should be longer than the time the actuator needs to perform one step,
Velocity * Time Step /
max velocity
plus the communication and settling times of the hardware. Otherwise the targets pile up in the actuator thread and the actuator lags behindthe Time Step should be short enough for the ramp to look continuous at the scale of your experiment: with a long time step, the actuator moves by large increments and stays still in between, the ramp becomes a staircase
the steps cannot be smaller than the resolution of the actuator (or of the controller setpoint): the Time Step should be at least
resolution / Velocity
Without steps, these questions are handled by the hardware itself, which is often the best option when the controller has a built-in ramp: the setpoint of a temperature controller, the ramp rate of a power supply, the velocity of a motion controller… The Duration of the extension should then match the time the hardware takes to go from Start to Stop at its own speed, a little longer to be safe: any extra time just records the end of the ramp, while a too short duration stops the acquisition before the end.
2.5.6.5.3. The acquisition rate
During the ramp, a detector acquiring every T seconds (its acquisition time or the Refresh Grab period,
whichever is longer) gives a point every Velocity * T in actuator units. This is the sampling of your data
along the ramp: to resolve a feature of width w (a resonance, a phase transition…), you need several points
within it, that is Velocity * T << w. If not, slow down the ramp (longer duration) or speed up the acquisition.
Likewise, as the actuator keeps moving while a detector integrates, each data point is averaged over
Velocity * integration time: this blurring must stay below the resolution you are looking for.
The same goes for the values of the ramping actuator itself: they are polled every Refresh Grab, and the histogram can only be as precise as these values. Its Nbin setting should be consistent with the number of points actually acquired, see The histogram.
2.5.6.5.4. A worked example
You want to record a signal as a function of the position of a stage moving from 0 to 20 mm, whose maximum velocity is 5 mm/s, with a detector acquiring at 50 Hz:
the minimum duration is 20 / 5 = 4 s. Choosing 10 s (2 mm/s) leaves a comfortable margin for accelerations
with a Time Step of 100 ms, the stage moves by 0.2 mm at each of the 100 steps, which takes 40 ms at full speed: the stage has the time to complete each step before the next one
with a Refresh Grab of 20 ms, the detector gives a point every 2 mm/s × 20 ms = 40 µm, that is about 500 points over the ramp. As the stage moves by 0.2 mm steps, the histogram should not use more than 100 bins (one per step): more bins would only resolve the staircase. To get a finer result, reduce the Time Step, or use the built-in velocity of the controller (Use Steps unchecked)
Tip
Even when the actuator lags behind the ramp, the histogram stays correct: its x axis is computed from the values actually logged for the ramping actuator, not from the targets sent by the extension. A lagging actuator only reduces the range actually covered. The same is true when the ramped quantity is not exactly the one you control, for instance the setpoint of a heater versus the temperature of the sample: log the sensor as one of the Actuators to save and select it as the Ramping Actuator of the histogram.
2.5.6.6. Data logging
If the Log action is checked when the ramp is started, all the data acquired during the ramp are saved in the h5 file selected using the file toolbar, or automatically created using the standard naming convention, see The H5 file manager:
the data of the selected detectors, at each grab
the values of the ramping actuator and of the selected actuators, at each polling
Each ramp creates a new node in the h5 file, named Ramp000, Ramp001… under the RawData group. The
settings of the extension are saved as attributes of this node, so that the parameters of the ramp can be retrieved
later. Under this node, each control module has its own node where its data are saved with their time stamps, as done
by the DAQ_Logger: detectors and actuators are acquired asynchronously, each one at its own
rate. The resulting file can be explored with the Data Browsing: the H5Browser module.
Dataset_20261003_000.h5
└── RawData
    ├── Ramp000                  first ramp
    │   ├── Actuator000          the ramping actuator (values + time stamps)
    │   ├── Actuator001          another selected actuator
    │   ├── Detector000          a selected detector (its data + time stamps)
    │   └── ...
    └── Ramp001                  second ramp
        └── ...
If Log is not checked, the ramp is applied and the modules are acquired (their data are displayed in their own viewers), but nothing is saved and no histogram is computed.
2.5.6.7. The histogram
The logged data are a set of independent time series: the values of the ramping actuator on one side, the data of each detector or actuator on the other side, each with their own time stamps. What you are generally interested in is the data as a function of the ramping actuator value, for instance a signal as a function of the temperature. The histogram computes it:
the time window is restricted to the part of the ramp where the ramping actuator goes from the histogram Start to Stop values
this time window is divided into bins. Their number is either set by the user (Nbin) or estimated automatically from the data (AutoBin)
in each time bin, the values of the ramping actuator are averaged, as well as the data of each other module. Empty bins are discarded
The result is displayed in the Histogram dock: each logged data is plotted as a function of the averaged ramping actuator value. 0D data (a value at each time) are displayed as curves, higher dimensionality data keep their signal axes, for instance a spectrum acquired during the ramp is displayed as a 2D map (ramping actuator value vs. wavelength).
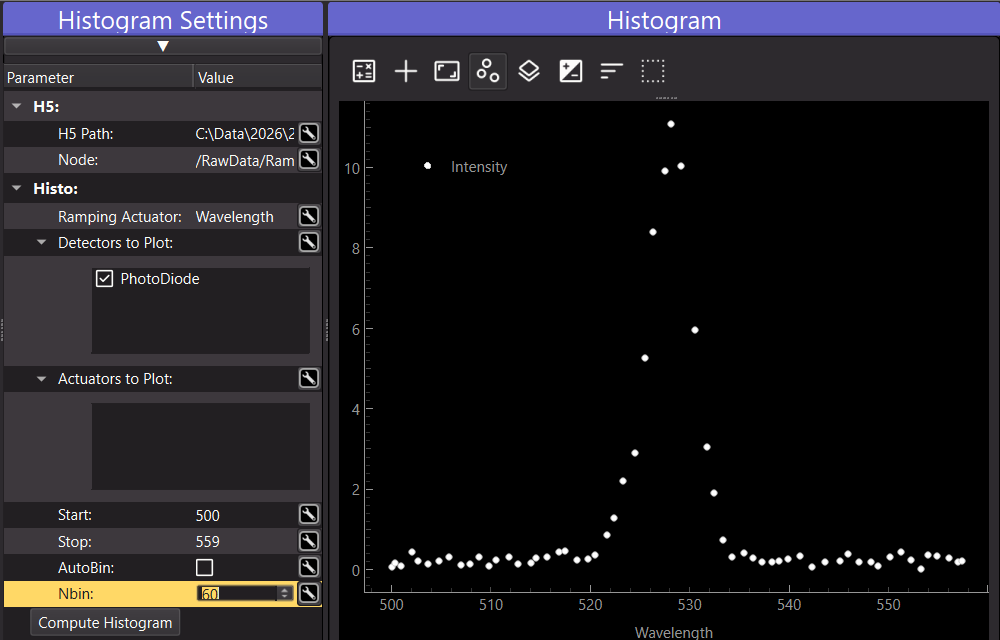
Fig. 2.83 The histogram settings and the resulting data plotted as a function of the ramping actuator value.
The Histogram Settings (Fig. 2.83) are:
H5 group:
H5 Path: the h5 file the data are read from (read only)
Node: the ramp node (
Ramp000,Ramp001…) to process
Histo group:
Ramping Actuator: the actuator used as the x axis of the histogram, by default the ramping actuator. Any other logged actuator can be selected, for instance a temperature sensor giving the actual temperature while the setpoint of the heater was ramped
Detectors to Plot / Actuators to Plot: the logged modules to be displayed as a function of the ramping actuator
Start / Stop: the range of the ramping actuator values to process, limited to the values actually logged
AutoBin: if checked, the number of bins is estimated from the data
Nbin: the number of bins, editable when AutoBin is unchecked. Increasing it gives more points but a noisier average
Compute Histogram: recomputes the histogram. Changing any of the settings above does it as well
2.5.6.7.1. Live histogram
During a logged ramp, the histogram of the current ramp node is recomputed every Refresh Plot period from the data already written in the file. The h5 file being opened in SWMR mode (Single Writer Multiple Readers), the data can be read while they are being saved, see The H5 file manager.
While ramping, the Node, Ramping Actuator, Start and Stop settings are locked to the current ramp. The Detectors to Plot / Actuators to Plot selections and the binning (AutoBin, Nbin) can still be changed: they are used at the next refresh of the live histogram. The modules to plot are chosen among the saved ones, and your selection is kept from one ramp to the next (modules saved for the first time are selected by default).
2.5.6.7.2. Offline analysis
Once the ramp is over and all the data have been saved, the file is reopened in read mode and the histogram settings are enabled again: the bins, the range or the modules to plot can be changed to refine the result.
The histogram of a previous ramp can also be computed by opening its h5 file using the Open file action of the file toolbar. The Node list is then filled with the ramp nodes of the file (the last one is selected), the lists of actuators and detectors with the modules having logged data, and the histogram is computed.
2.5.6.8. Configuration
A few defaults are set in the [ramping] section of the PyMoDAQ configuration file (see Preferences files):
[ramping]
duration_units = [ "s", "min",]
ramp_setting = [ "duration", "velocity",]
For both entries, the first element of the list is the one used, the other one being the other possible choice:
duration_units: the units of the Duration setting, and of the time part of the Velocity units. Use[ "min", "s",]for long rampsramp_setting: which of Duration or Velocity is set by the user, the other one being computed. Use[ "velocity", "duration",]to enter the ramp speed directly
The extension has to be restarted for changes to be taken into account.