2.5.1.7. Scan Manager
The Scan Manager allows to define a complete scan once, save it under a name and call it later on. It is one of the
managers sharing the same structure as the DashBoard Managers (see DashBoard Managers): a GUI to create, copy,
save, reload, delete and execute entries, here scans, saved as .scan files in the scans folder of the PyMoDAQ
configuration folder (see Preferences files).
Note
The Scan Manager is meant to define the scans that the Sequencer will call, in order to chain scans with other actions (see Sequencer). The corresponding scan element of the Sequencer does not exist yet.
A scan entry contains:
the actuators and detectors selected for the scan
the Scanner settings: scan type, subtype and the start, stop, step… values of each actuator (see Selecting the type of scan)
a selection of the other settings of the DAQ_Scan (time flow, scan options, plotting options…) and of the h5 saver (see Settings) together with their values
whether the scan should be started once all the settings have been applied
2.5.1.7.1. Using a scan
The Scan Manager toolbar (see Fig. 2.54) is part of the DAQ_Scan window. Its first button opens the Scan Manager window, the list gives access to the saved scans and the last button executes the selected scan.
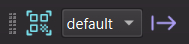
Fig. 2.54 The Scan Manager toolbar of the DAQ_Scan: open the manager, list of the saved scans and execute the selected one.
Executing a scan applies, one after the other, the selection of the actuators and detectors, the scanner settings and the selected settings. A window displays the progress and flags the entries that could not be applied (for instance a module that is not part of the experiment loaded in the Dashboard). If the scan entry has been defined to do so, the scan is then started, exactly as if the Start button of the toolbar had been pressed. If not, the DAQ_Scan is only configured and the scan can be started manually.
2.5.1.7.2. Defining a scan
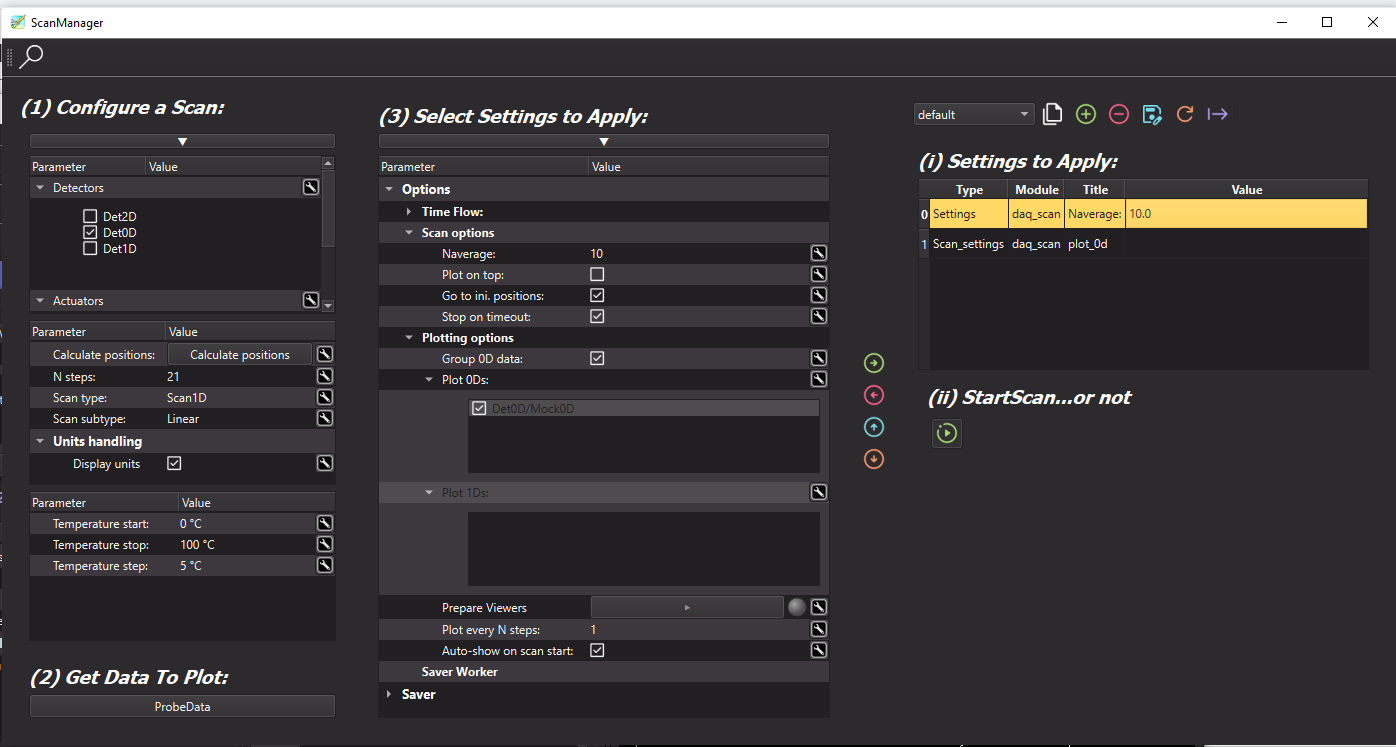
Fig. 2.55 The Scan Manager toolbar of the DAQ_Scan: open the manager, list of the saved scans and execute the selected one.
The Scan Manager window is divided in numbered steps:
Configure a Scan: select the actuators and the detectors and set the scanner, as in the DAQ_Scan main window (see Selecting the type of scan).
Get Data To Plot: click on the ProbeData button to probe the selected detectors and list the data they generate in the Plot 0Ds and Plot 1Ds options, then select the data to be plotted live (see Selecting the data to render live).
Select Settings to Apply: browse the settings tree and use the Add arrow to put in the Settings to Apply table the settings (and their current value) that should be set when the scan is executed. The table can be reordered (Move up / Move down) and settings can be removed (Remove). The Show All Settings button displays all the settings (the ones that can be configured are in green).
Settings to Apply: the table of the settings that will be applied.
Start Scan… or not: the Start Scan button of the toolbar below the table defines if the scan should be started when the entry is executed.
Then save the scan with the Save button of the manager toolbar, after having created it with New (or Copy).